The Family Tree
The family tree gives you a graphical view of how your relatives connect. It's an interactive map where you can navigate, zoom, search, and filter — and jump directly to a person's details with a single click.
Getting started
Go to Family Tree in the main menu. The tree won't display until you've chosen a focus person — use the search field in the top right and start typing a name.
The search field searches all persons in the database, by name, place of birth and death, tag, and category. You don't need to type å, ä, and ö — "lundstrom" finds "Lundström". Without search text you can scroll the list; more persons load when you reach the end.
Why does the tree need a focus person?
A complete family history can contain hundreds or thousands of people. Drawing them all at once would be unmanageable. The focus person is your starting point — from here, ancestors, descendants, and partners are drawn out in relation to that specific person.
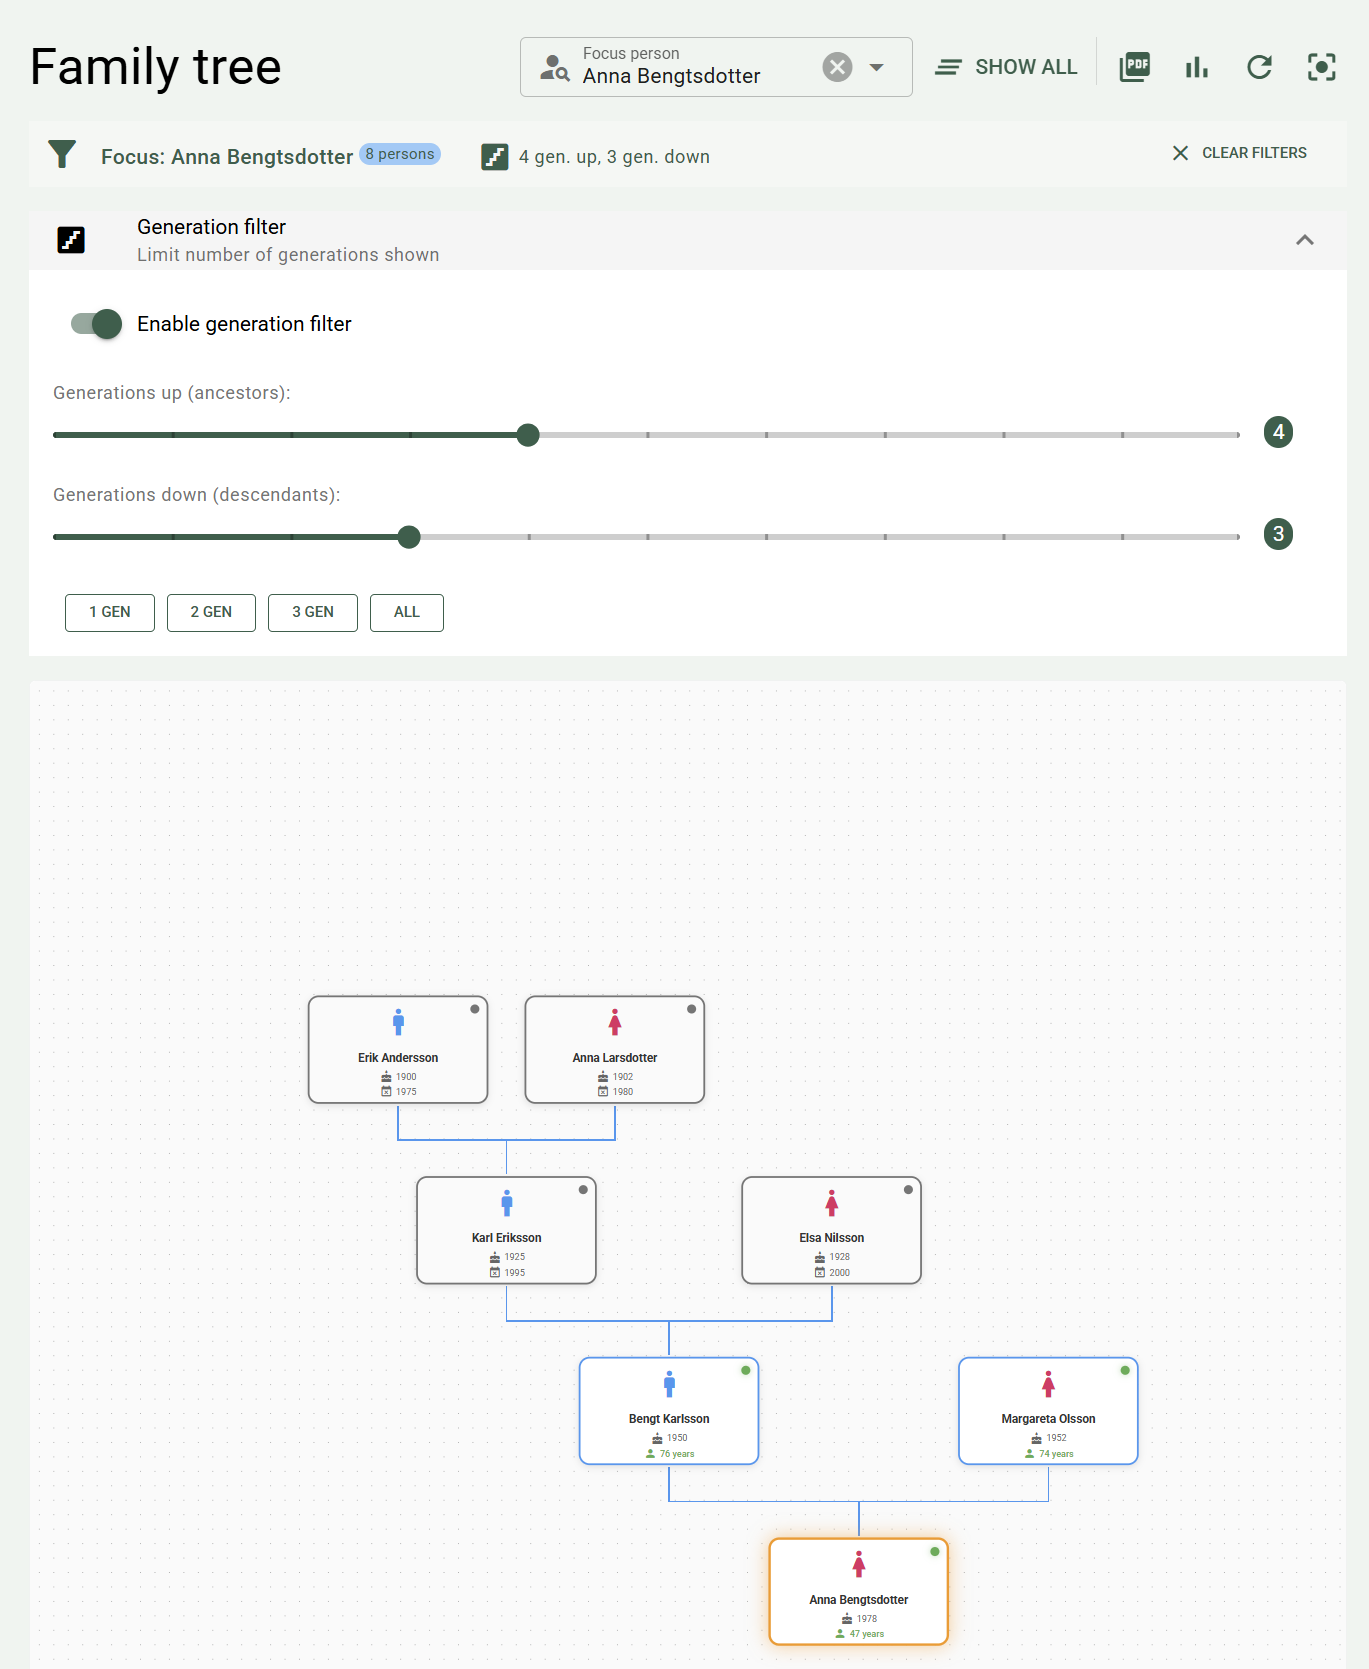
Person cards
Each person is shown as a card in the tree with:
- A profile picture or a gender icon if no picture exists
- Name
- Year of birth and year of death (or age, if the person is living) — also when they come from a birth or death event, see Birth and death
- A small status indicator in the corner — green for living, gray for deceased
Legend: - Yellow border = focus person, the person chosen to build the tree around - Blue border = living (or not registered as deceased) - Brown border = deceased - Figure = gender - Cake with year = year of birth - Figure with age = current age - Calendar with cross = year of death
Click a card
Clicking a person card opens a quick view with the person's details and relationships. From there you can go straight to editing, bookmark the person, link them to a research note, or open Research branch.
The quick view shows:
- all of the person's details — biography, notes, nickname, alternate names, and places
- the relatives as cards, with a pencil and a trash can for editing or removing the relationship, and with the relationship's note at the bottom of the card
- all of the person's events
If you add, change, or delete a birth or death event in the quick view, the person's date and place are updated right away in the quick view.
Click a relative's name to open the relative in a quick view on top. If you change relationships in the quick view, the tree is redrawn when you close it.
The buttons on the card
When you hover over a card, two small buttons appear in the top left corner:
- Focus (the focus lens) — makes that card the new focus person. The tree is redrawn with that person as the center point.
- Research branch — opens the branch view for the person, where parents, partners, children, and siblings are shown in tables with dates and places, and where you can add, change, and remove relationships.
→ Read more about Research branch
Navigate the tree
The tree is freely movable and zoomable:
- Scroll with the mouse to zoom in and out
- Click and drag to pan — the cards stay in place, so the whole view moves even if you drag a card
- The "Center view" button (a target icon in the toolbar) centers and adjusts the zoom level so the whole tree fits on screen
Generation filter
Once a focus person is chosen, you can limit how many generations are shown with the generation filter (an expandable section under the toolbar):
- Generations upward — how many generations of ancestors are shown (0–10)
- Generations downward — how many generations of descendants are shown (0–10)
There are shortcut buttons for common choices: 1 gen, 2 gen, 3 gen, and All.
The sliders and shortcut buttons are shown when Enable generation filter is checked. With the filter turned off, 3 generations up and 3 down are shown.
The generation filter is hidden until you choose a focus person
The filter is only relevant in relation to a focus person, so it isn't shown until you've chosen one.
Multiple partners
If a person has had several partners, the tree view shows a partner switcher — a small navigation element next to the card showing which partner is currently active and how many there are in total. Use the arrows to browse.
Unknown parent
If a person has registered children but is missing a registered parent on one side, the tree view shows an "Unknown" card with a dashed border. It's a reminder that there's a gap to fill in. Click the card to add a new parent.
The network view shows no such cards — only what has been filled in is shown there.
Export as PDF
Click the PDF icon in the toolbar to export the current tree or network as a PDF file. You can specify:
- File name
- Paper size — e.g. A4 or A3
- Orientation — portrait or landscape
- Image quality
- Whether to include metadata (date, number of people, active filters)
- Whether to use a white background (recommended for printing)
- Whether to include a list of persons, see List of persons
The file is saved in the export folder's Documents\PastPaths\Reports subfolder (more about the export folder):
- Save PDF saves the file and shows a button that opens the folder.
- Open and print saves the file and opens it in your PDF reader, where you can preview and print it.
The export always reflects the current view — the tree or the network, with the generation filter and the network's choices in the Show panel. The whole tree is included, also what isn't visible on the screen.
Names with letters outside the Swedish alphabet — for example ł, ő, or Cyrillic letters — are printed as they were entered.
Tips for large trees
For a tree with many generations, landscape A3 (or even larger) at high image quality gives the best results.
List of persons
Check Include list of persons to get a list of the persons after the image. The list follows what's shown in the tree or network and has up to three parts that you choose separately. Below the checkboxes, you can see how many persons are shown.
| Part | Contents | Available in |
|---|---|---|
| Family | Name, lifespan, and relationship to the focus person | The tree and the network |
| Other relationships and roles in events | Who has the connection, what kind of connection it is, and to whom — for roles also the event, year, and place | The network |
| Events | The events behind the roles, with date, place, and all participants with their roles | The network |
Family starts with the focus person, followed by the closest relatives. The relationship is written as a kinship term (for example "grandmother", "cousin", or "sister-in-law") or as a chain (for example "mother's brother's son"). If the relationship runs through persons who aren't visible in the network, it's still included. If there are several paths — for example with a cousin marriage — the shortest comes first and the others follow in parentheses after "also". Persons who can't be reached through the relationships get "No known relationship". → More about how kinship is worked out
Godparents, witnesses, and others who are only included through another relationship or an event aren't in Family but in the second part. The last two parts require Other relationships and Roles in events respectively to be turned on in the network's Show panel. If they're turned off, the export dialog says so.
Statistics
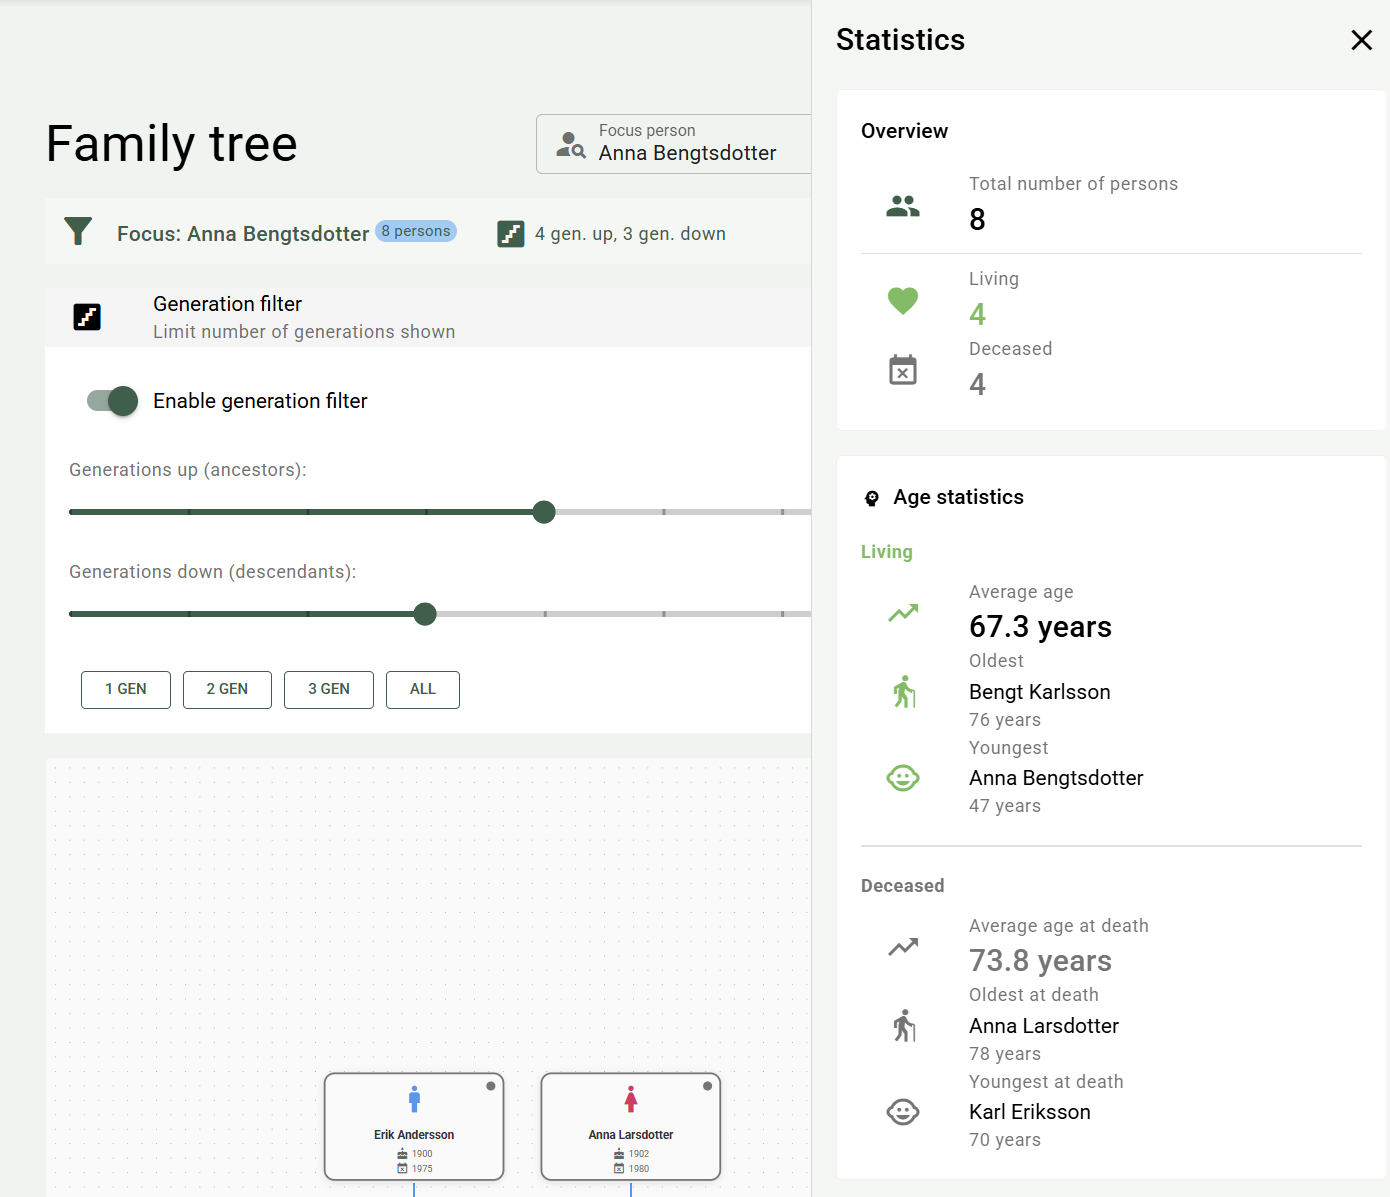
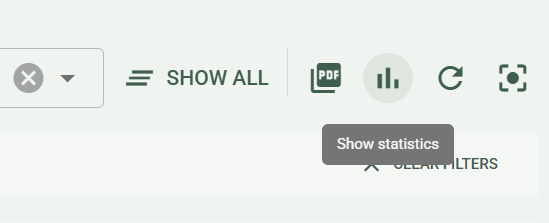
Click the bar chart icon in the toolbar to open the statistics panel. It shows key figures for the persons in the tree. Godparents, witnesses, and others who are only included through another relationship or an event aren't counted.
Overview — total number of persons, split into living and deceased.
Age statistics — average age of living persons, average age at death for deceased persons, and the oldest and youngest in each group.
Gender distribution — count and percentage per gender.
Relationships — number of partner, parent–child, and sibling relationships, broken down by whether they involve living or deceased persons.
Generation span — how many generations the tree spans.
Time span — the earliest and most recent registered dates of birth and death among the persons in the tree.
The network view
Use the Tree and Network buttons in the toolbar to switch between the family tree and the network view. The program remembers which view you chose.
In the tree, everything starts from the focus person: ancestors upward and descendants downward. If the same person appears in several branches, they're drawn several times. In the network, every person is drawn once, and parents and children are connected through small family points. That shows what a tree can't:
- Cousin marriages and other pedigree collapse — two branches meet in the same ancestor
- Stepfamilies — a partner's children with someone else, with all of the children's registered parents
- Multiple marriages — each couple has a family point of its own
Lines
| Line | Means |
|---|---|
| Solid blue | Biological parent |
| Dashed blue | Adoptive, foster, or step-parent, guardian, or ex-partner. The type is written on the line down to the child, and ex-couples are marked Ex. |
| Green dotted | Other relationship — godparent, witness, or other |
| Brown dotted | Role in an event — witness, officiant, attendee, or other |
If a parent is missing, nothing is shown — the network has no empty placeholders. Siblings with a sibling relationship but no registered parents hang from a hollow point.
Choose what is shown
Open the Show panel with the button in the top right of the network. There you choose:
- Parents and ancestors and Children and descendants — turn them off to see the focus person with partners and siblings. If a parent is connected to someone in the network through another relationship or an event, for example as a baptism witness, they're still shown, together with the parent–child line.
- Partners without children together, Siblings, and Stepfamilies
- Other relationships — godparents, witnesses, and other, each on its own
- Roles in events — persons who took part in the same events, see Through events
Other relationships and roles in events are turned off from the start, since they can be many in a large family tree. Your choices are remembered. The panel also has a legend.
Persons who are only included through another relationship or an event are placed in the row below the person they're connected to.
The generation filter applies to both views
The generation filter controls how many generations are fetched, and it applies to both the tree and the network. The checkboxes in the Show panel only affect the network.
Labels on dotted lines
The dotted lines have no text from the start, so the labels don't cover each other. Hover over:
- a person — the person's dotted lines are highlighted with labels, and the others are dimmed
- a line — a box shows the full text, for example "Karl Svensson is the godparent of Anna Berg", or who had the role in the event and when
Check Show all labels in the panel to show every label at once, for example before a PDF export.
Click in the network
The person cards work as in the tree: a click opens the quick view, and the buttons on the card make the person the focus person or open Research branch.
What's shown in the tree?
The tree is built on the relationships you've registered. It's the direct connections — parent–child, partner, sibling — that determine how the tree looks. Indirect kinship (grandmother, cousin, brother-in-law) isn't shown as cards of its own but is reflected in the structure. It can be included as text in the list of persons in the PDF export.
See also
- Relationships — how to register and edit connections between persons
- Persons — how to create and edit personal information
- Timeline — a chronological view of events